Surviving Submarine Cable Cuts with SD-WAN SLA Design
Submarine cable cuts in the Red Sea pushed latency from <50ms to 300ms+ across six ISPs. Here’s how I redesigned SLA checks in FortiGate SD-WAN to keep links stable and reliable.
Normally, we keep internet latency to Google under 50ms across the SD-WAN fabric.
That’s the SLA target.
But when the Red Sea submarine cables went down (SMW4, IMEWE, EIG, FALCON), latency jumped past 300ms on all six ISPs at once. Links started flapping, users complained of “slow internet,” and the SD-WAN was marking circuits inactive every few minutes.
This post covers:
- What the SD-WAN showed during the cable cut
- Why I removed latency SLA for stability
- Why Cloudflare
1.1.1.1isn’t a good SLA target - How I combined three SLA profiles for reliable link monitoring
- CLI verification of SD-WAN service status
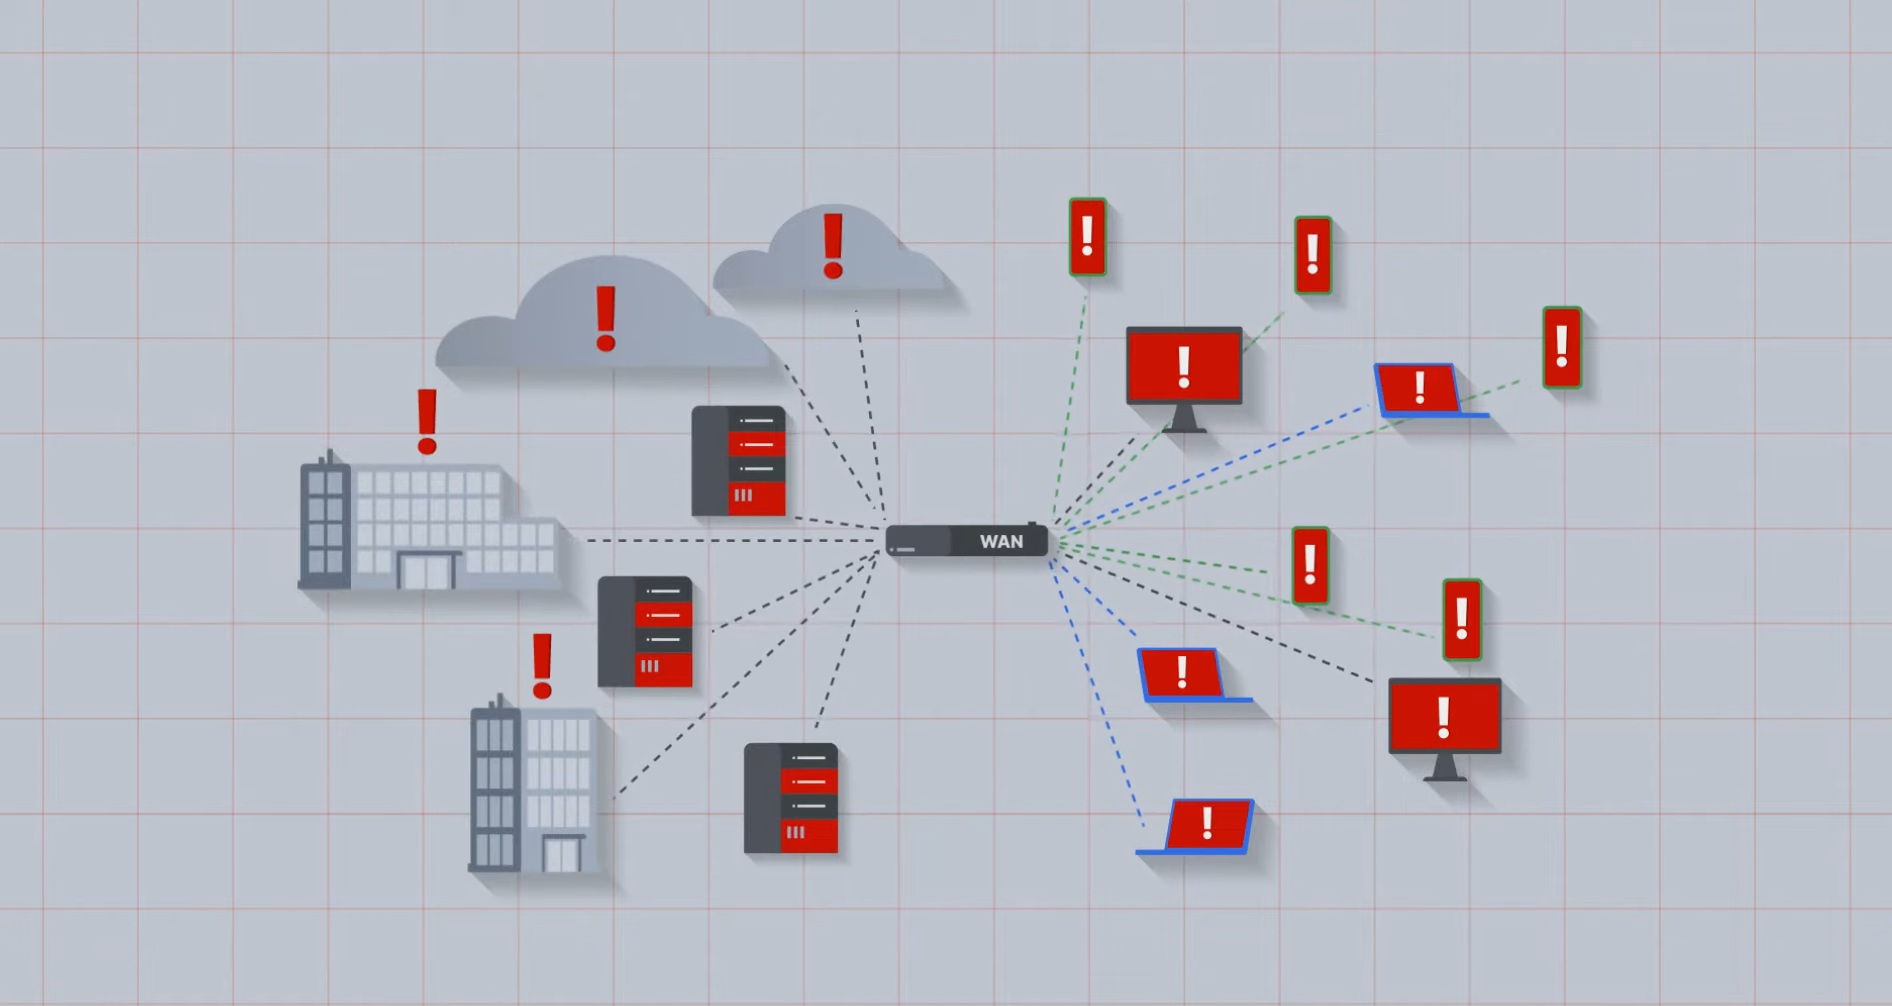
The submarine cable cut impact
The outage was not local. All six ISPs spiked to the same ~300ms latency to Google. This was a regional upstream event, not a provider issue.
With latency thresholds breached, the FortiGate started failing SLA checks, causing links to flap between active/inactive. That made the problem worse.
Adjusting SLA policy
To stabilize the fabric, I had to:
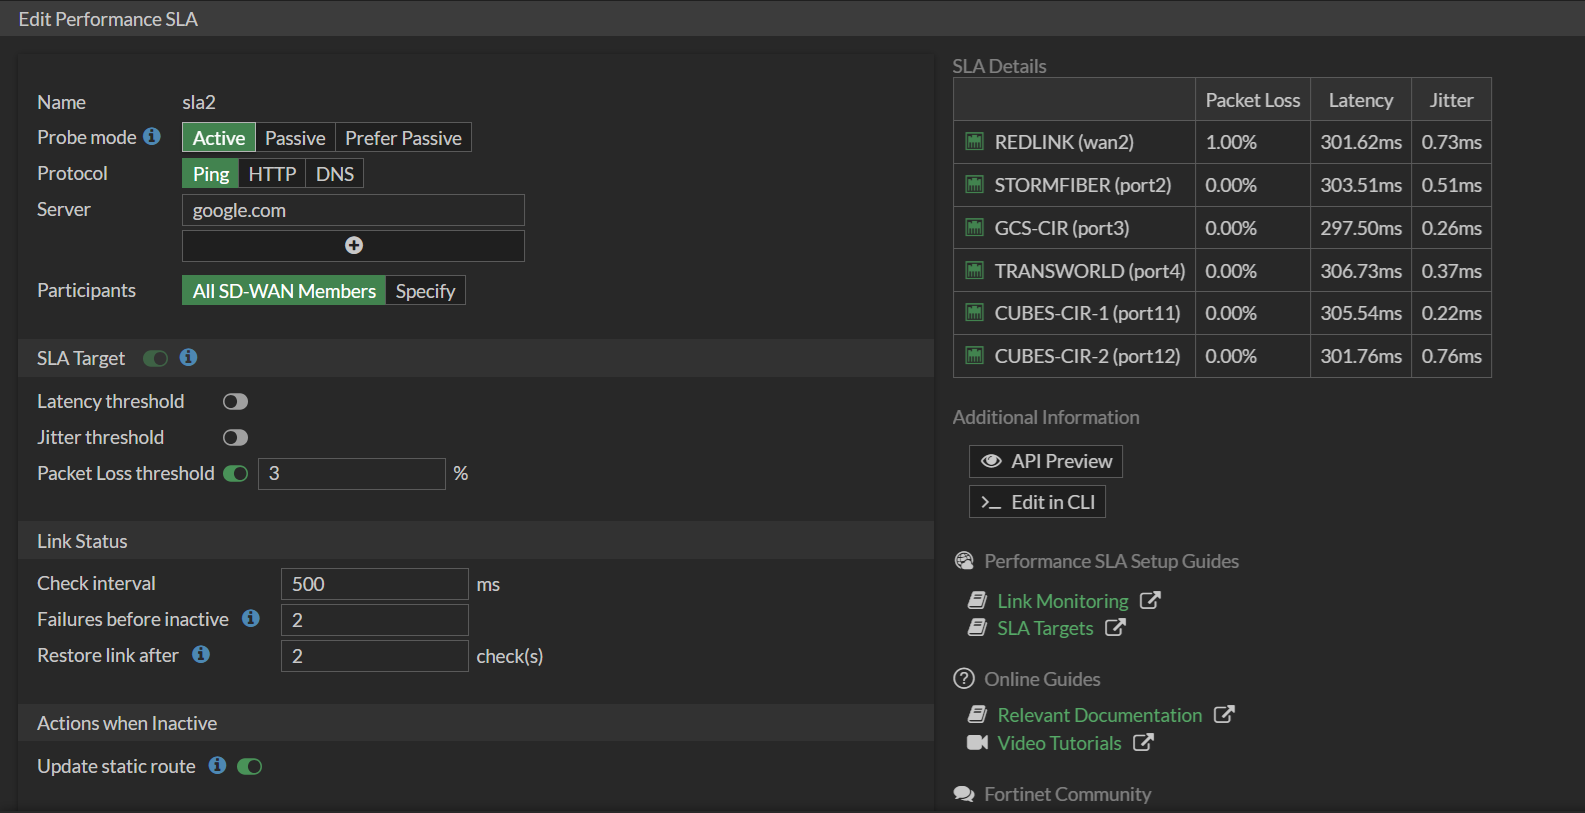
- Remove latency SLA for Google (to stop flapping)
- Keep packet loss SLA active (to detect real link failures)
This way, links stayed online, even if latency was poor.
Why Cloudflare wasn’t the answer
I tested Cloudflare 1.1.1.1 as an SLA target. It showed just 3ms latency, which looked perfect—but users were still complaining. Why? Because Cloudflare has local PoPs in Pakistan, so probes terminate inside the country. Google’s DNS (8.8.8.8) doesn’t have local nodes; traffic hairpins to India, UAE, or Singapore, which reflects the real international path. That’s why Google is a better SLA target for measuring true internet performance, while Cloudflare can give a false sense of “everything is fine.”
So while Cloudflare showed 3ms, users still felt the slowdown. It hid the upstream issue, which is why Cloudflare is not a good SLA choice for real performance monitoring.
Using multiple SLA checks together
Instead of relying on one SLA, I built three:
SLA CIR – Probes
8.8.4.4with latency/jitter/packet loss thresholds.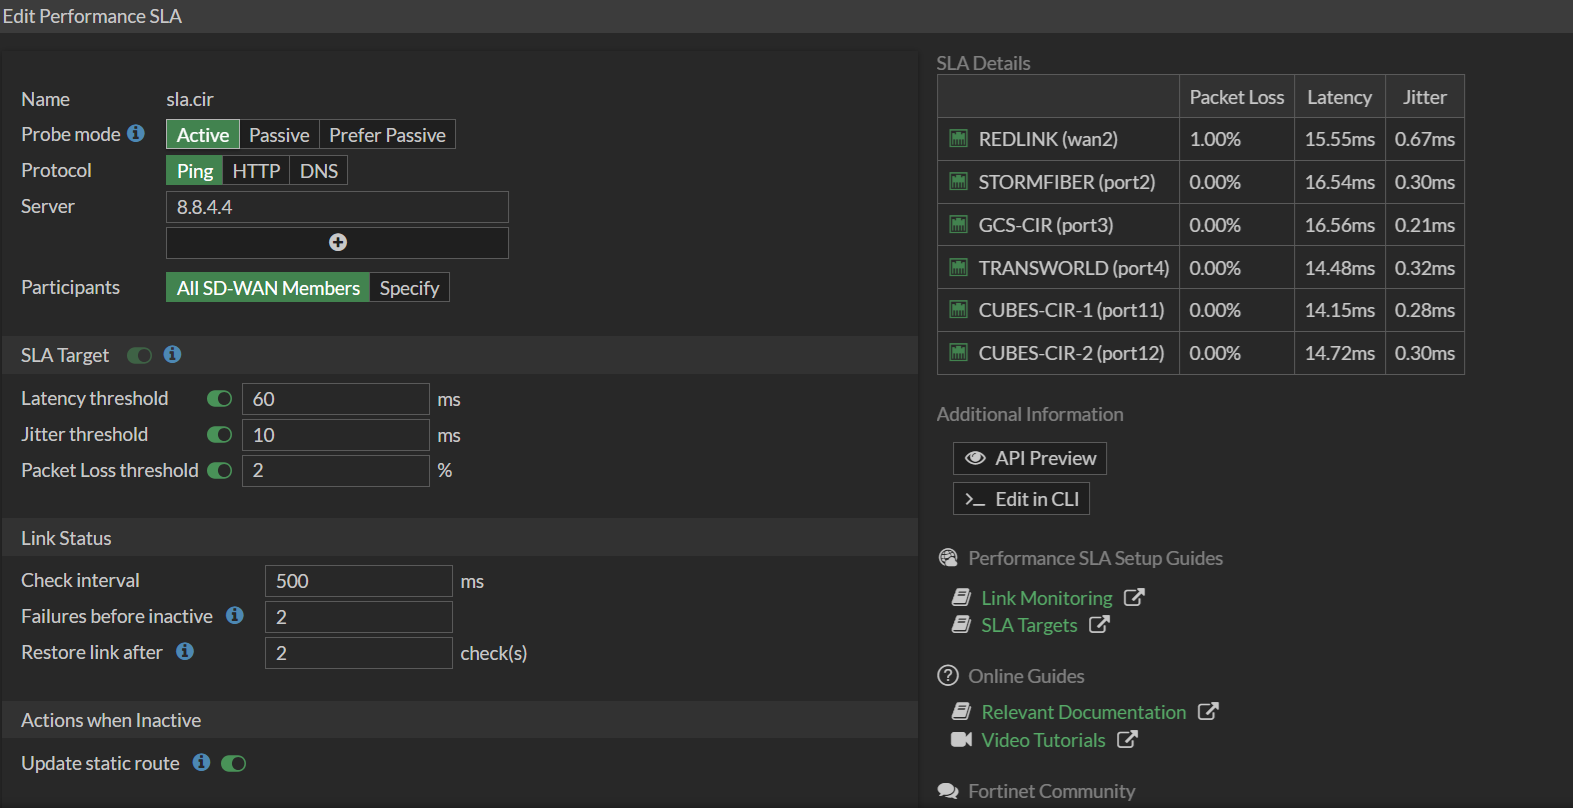
SLA Google – Probes
google.com, but only with packet loss threshold active.SLA Alt – Probes
8.8.8.8with latency/jitter/packet loss thresholds.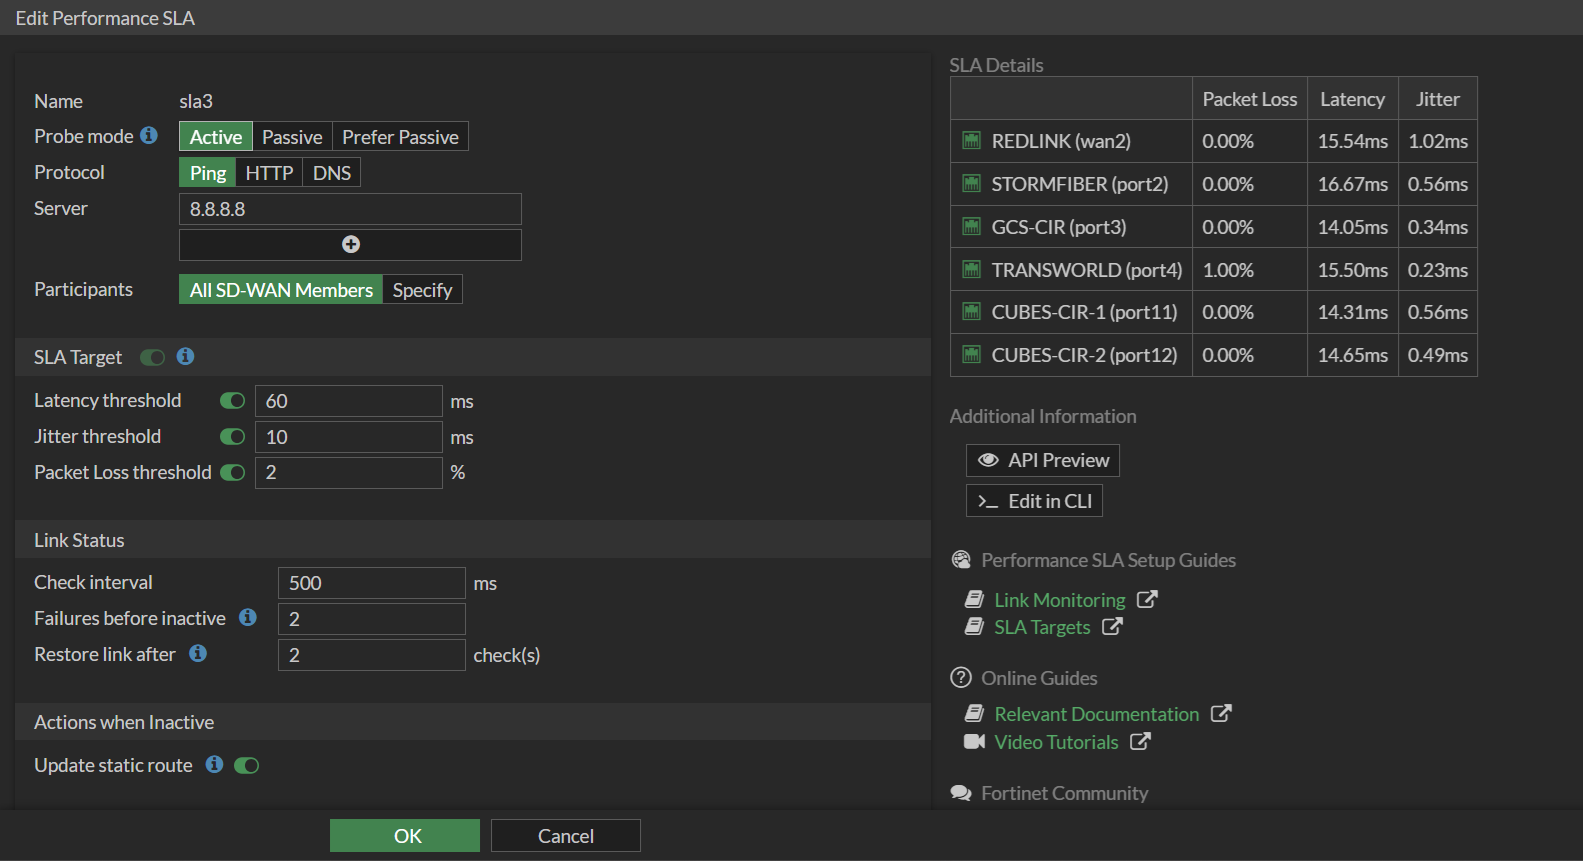
Each ISP member participates in all three SLA checks. This way, if one target is unreachable or skewed, others balance it out.
Verifying in CLI
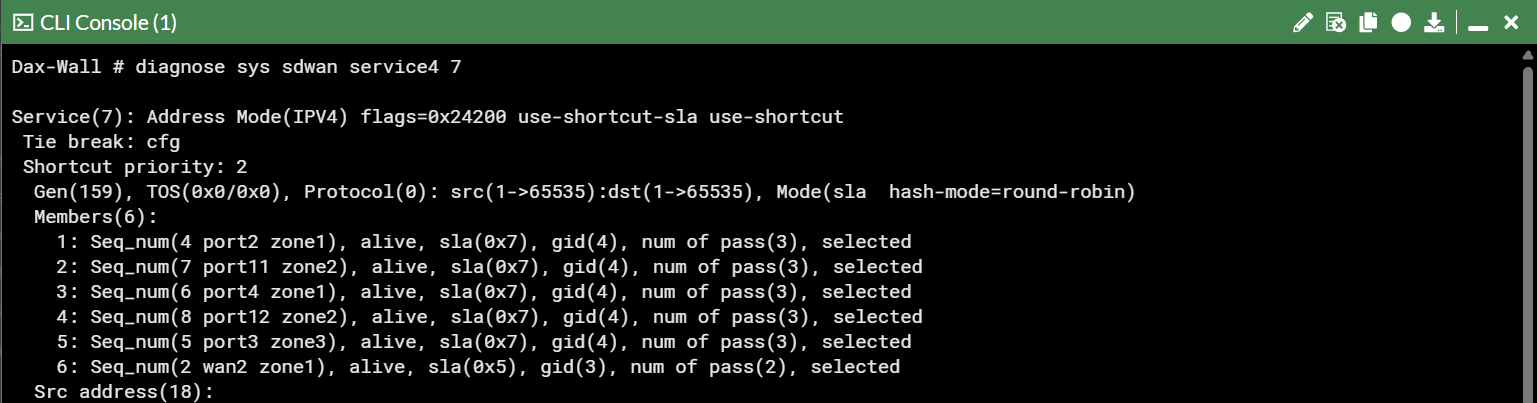
To confirm, I ran:
1
diagnose sys sdwan service 4 7
The output showed all six ISPs alive and validated across SLA probes:
Key lessons
- SLA design matters. One bad probe can flap an entire SD-WAN fabric.
- Packet loss is the real health check. Latency spikes don’t always mean link failure.
- Pick SLA targets carefully. Google reflects regional latency; Cloudflare doesn’t.
- Use multiple probes. Combining 8.8.8.8, 8.8.4.4, and Google gives balanced visibility.
- Always confirm in CLI. The GUI looks nice, but CLI proves what’s alive.
Closing
End-users saw “slow internet.”
The dashboard showed 300ms to Google.
The real issue was broken cables under the Red Sea.
With adjusted SLA policies and multi-target monitoring, the SD-WAN stayed stable and services continued running—even while the internet backbone itself was under repair.